Building a Home Network Intelligence Platform
As an IT professional, I've seen how information silos create massive blind spots in security analysis and fault detection. Recently, I've been playing with ways to tear down these barriers by centralizing data into a unified intelligence platform.
As a step stone for a unified way of i.e talking to Azure Sentinel and similar services.
During my first iteration i stumbled upon more than what i had hoped for, it turned into a real eye-opener about what my home network was actually doing.
The Architecture
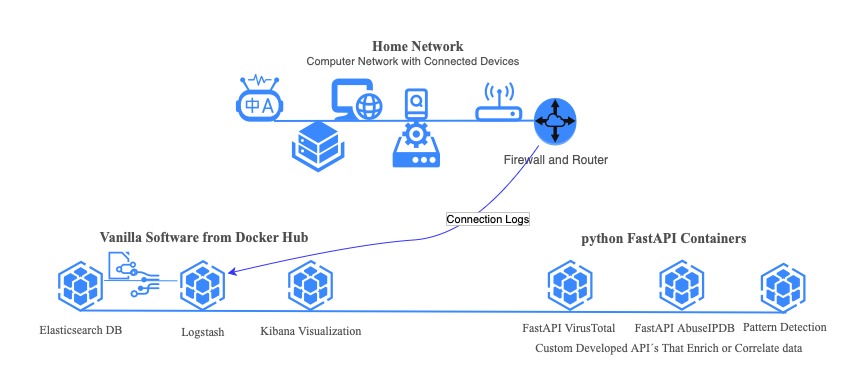
Old school IT Architecture usually put data in silos divided by profession. The network team, security team, operational team, developers, business services all put their own information in their own silos. Modern IT Architecture has evolved beyond this, pouring each silo in a common framework. In order to truly see what is happening, you need to have one common ground for accessing information about your IT Services. I chose ELK for this task and my home network is the data source.
The benefits of using an open framework such as ELK: You can plug in your own dataenrichment / analytics / AI Agents / whatever suits you or your business. Closed vendor solutions does not provide this.
Beyond the usual computers and phones, my network hosts everything from internet-connected washing machines and tumble dryers to smart air conditioners. Each device has its own network chatter, and I wanted to listen in on all of it. ( git repo)
Data Collection and Processing
All home routers i´ve come across supports logging. I configured my home router to forward the logs to my logstash docker container. Complete visibility into every packet entering or leaving my network.
The raw data goes through several transformation stages:
Data Normalization
Using Logstash, I normalized the syslog messages, transforming unstructured log entries into searchable fields within elasticsearch indices. This standardization is crucial for complex queries and correlations across different data sources. Just dumping the data is wasting correlaction opportunities where the real value lies.
Geographic Enrichment
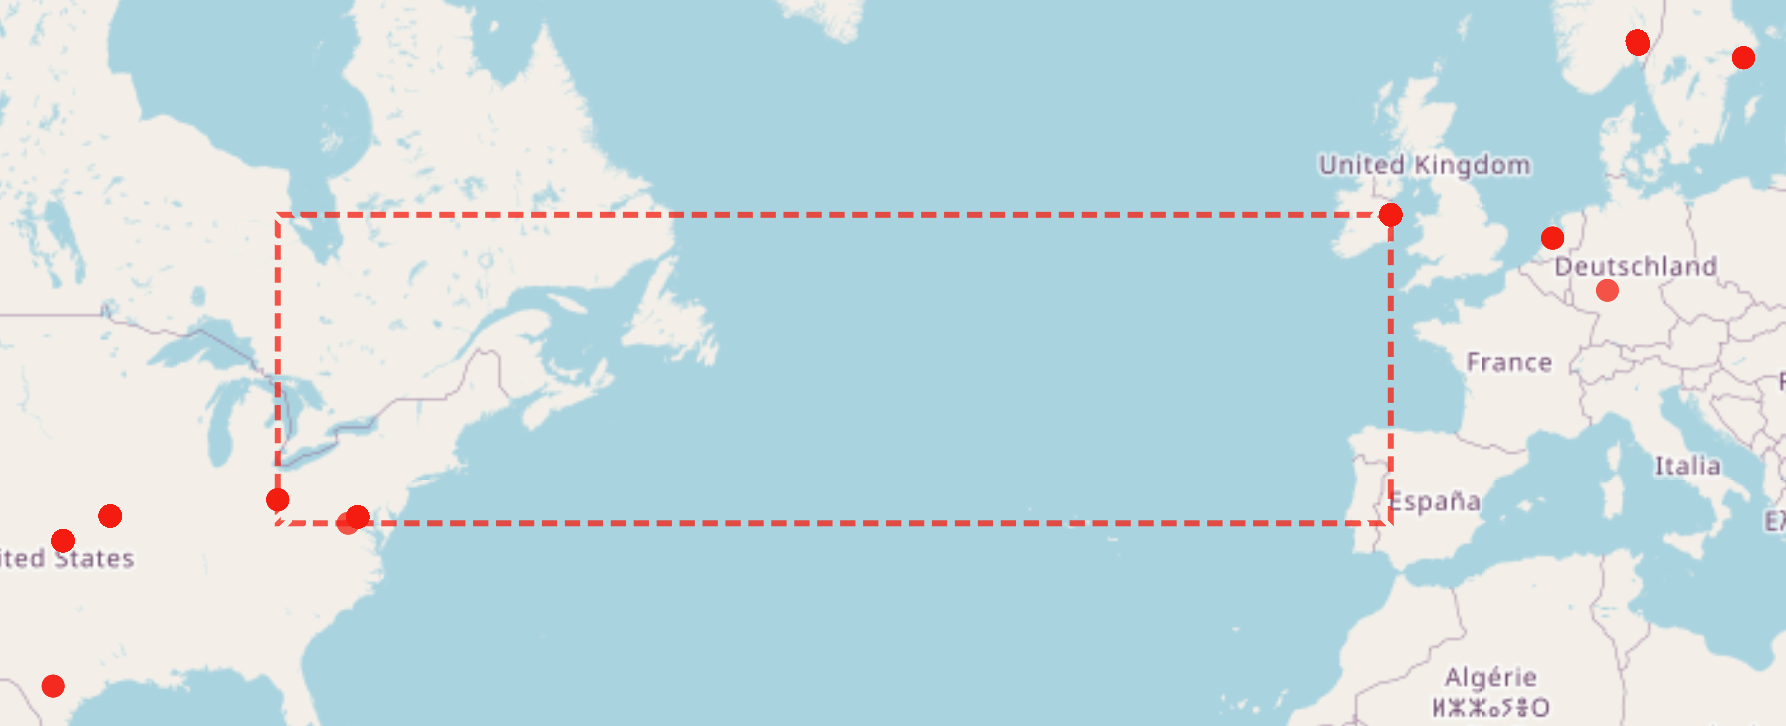
I implemented GeoIP enrichment directly in Logstash, mapping IP addresses to geographic locations. Processing this early in the pipeline reduces computational overhead and enables real-time geographic visualization.
Threat Intelligence Integration
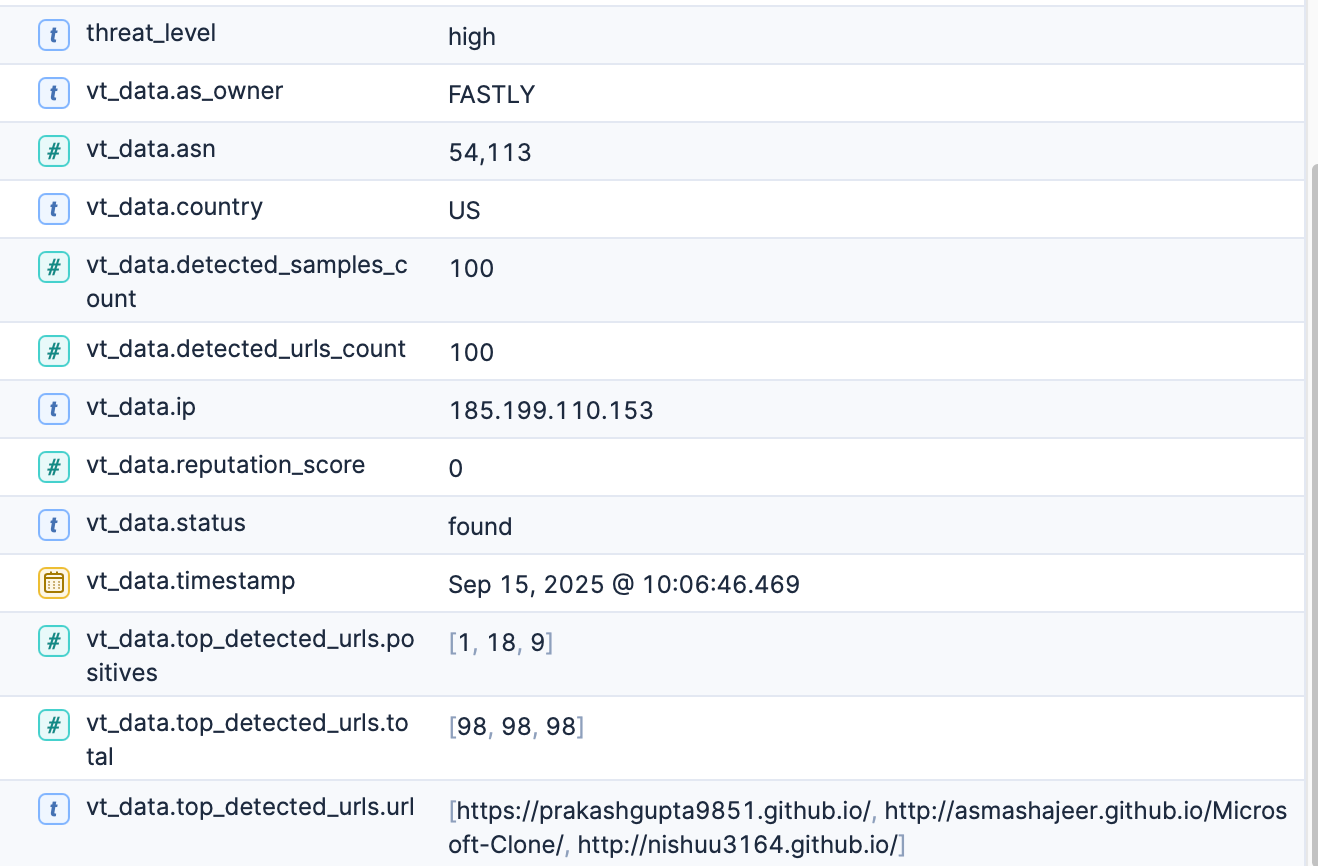
Here's where it gets interesting. I built a Python FastAPI for VirusTotal and another for AbuseIPDB that both queries for IP reputation and threat assessment. I also created a FastAPI for generic pattern detection such as "Give me the top 10 hosts that probed more than 20 ports on our public ip over the last 180 days". The benefits of having unconstrained pattern detection is both fun and eye opening.
Enriching my full network visibility with threat information proved valuable. With an open framework I can plug in and correlate.
A risky outbound connection is i.e my daughter particiating in a discord chat where a link to a "Roblox mod with a backdoor" was sent in the chat, or me browsing the internet where one of the ads in the ad-rotation on a webpage contains malware.
Threat intel is really stunning these days, giving you the abillity to discover if your internet connected washing machine is part of a DDOS network or a surveilance device (Such devices are perfect sleepers for professionals)
Visualization and Discovery
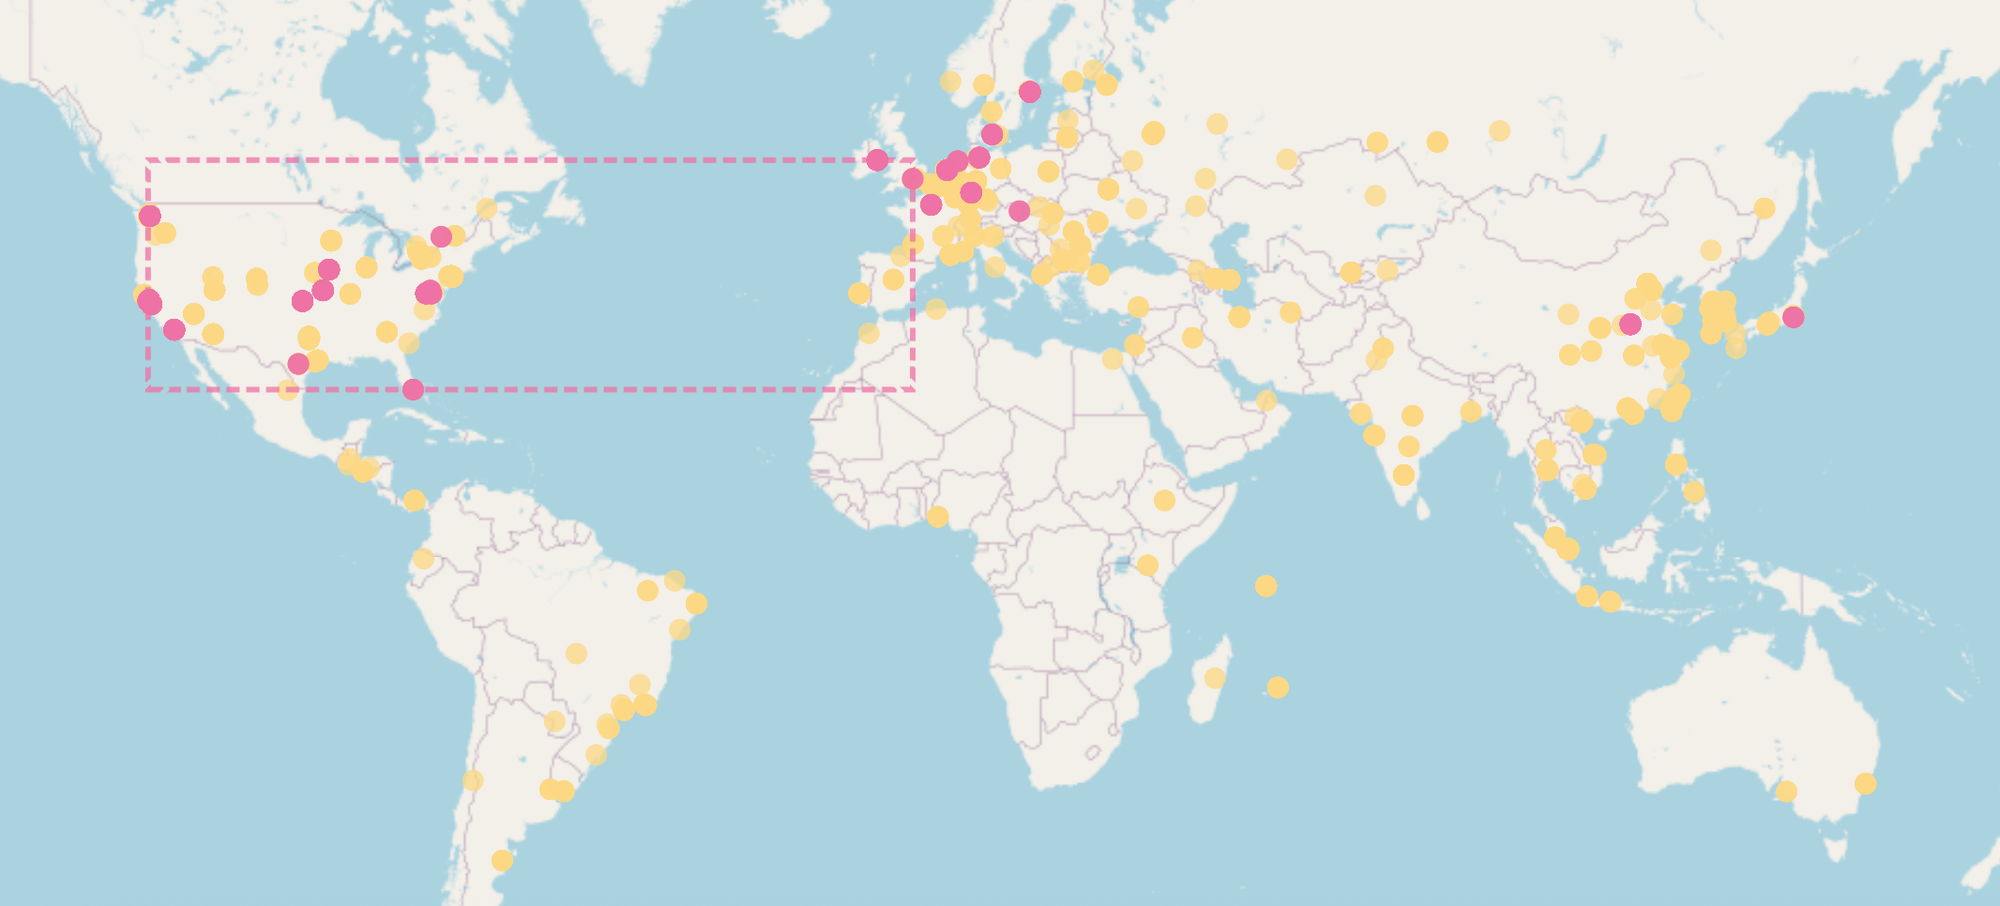
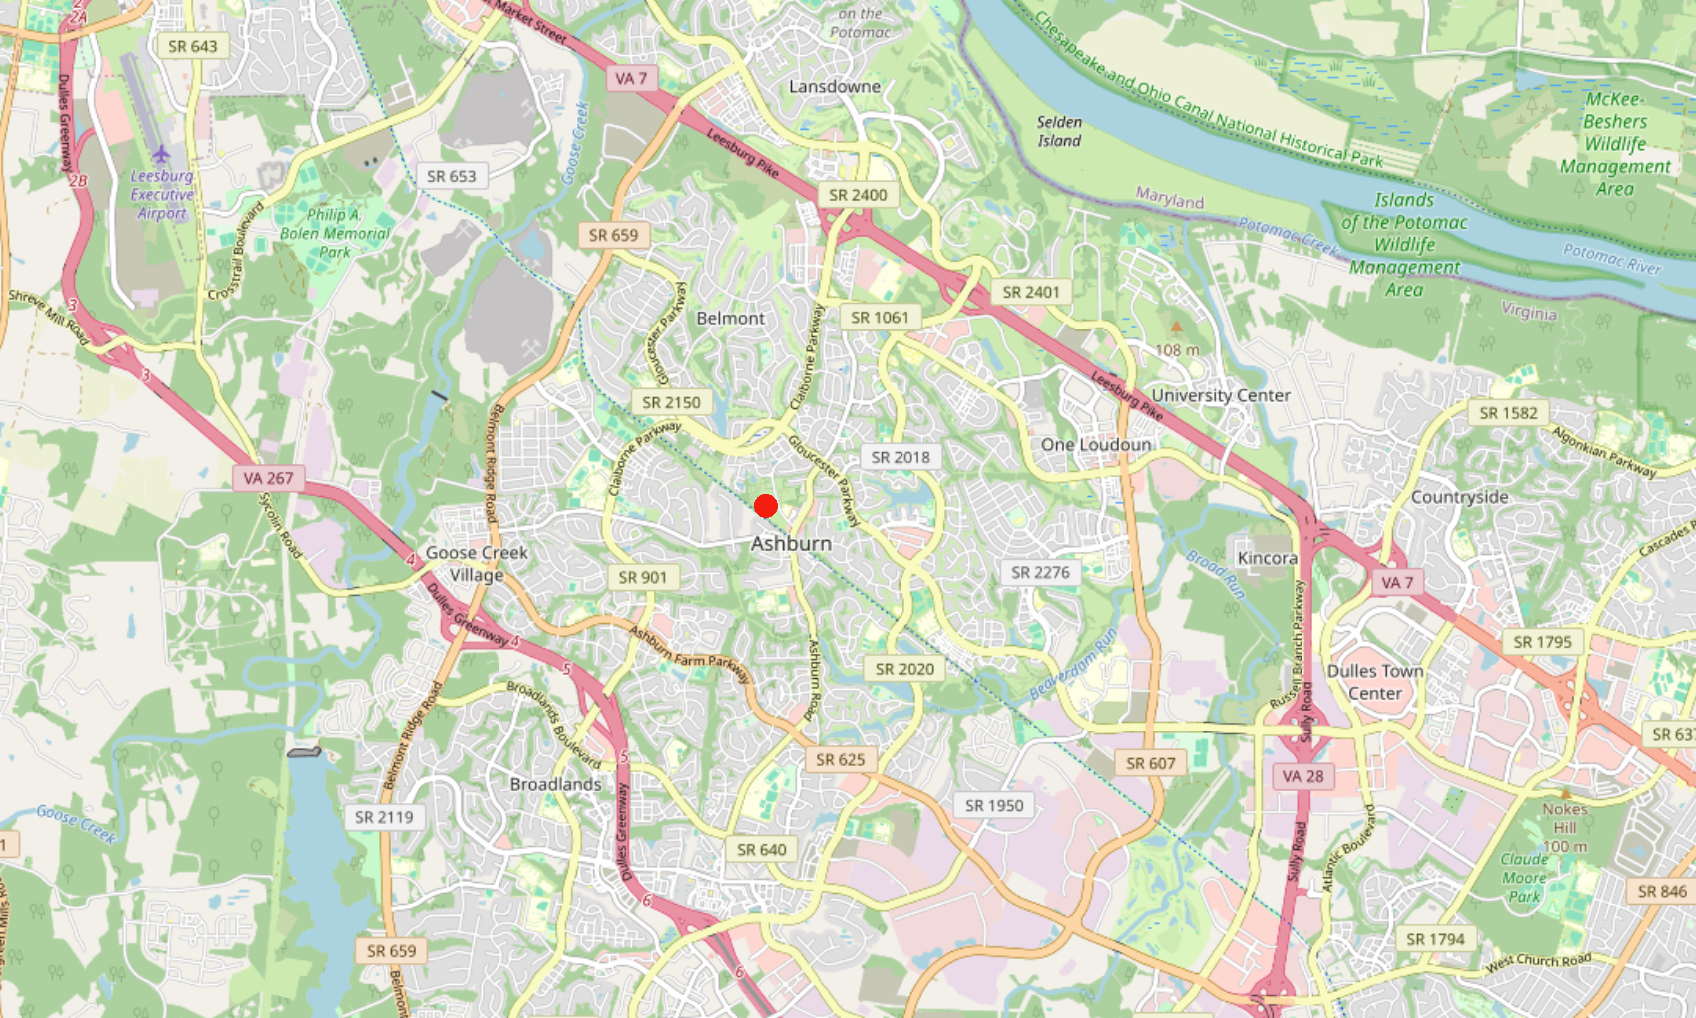
With Kibana as my presentation layer, I've created an interactive network map using free OpenStreetMap. If you want better maps: Switch to a paid service such as google maps or mapbox. This provides a foundation for an intelligence dashboard where I can:
- View aggregated traffic patterns over time
- Highlight risky connections based on threat intel from industry leading providers.
- Monitor unusual port activity.
- Track individual device behaviors (yes, even the washing machine).
- Abillity to identify "Slow and Stealthy" probers or attackers.
What I Actually Found
The initial results were pretty disturbing, honestly. Within hours of analyzing the data, I discovered something about my Samsung TV that made me want to throw it out the window. The default configuration was scanning whatever was displayed on screen and transmitting this information over the internet. Samsung's Automatic Content Recognition (ACR) service, apparently. This level of data collection, happening completely silently in the background, prompted me to yank the TV off my network immediately.. All smart TV´s do this, someone needs to write about the topic giving it more attention.
This really drove home a point: we have absolutely no clue what our "smart" devices are sharing about us.
My washing machine's internet chatter might seem harmless, but without visibility you wont know.
The Value of Long-term Analysis
Collecting detailed network telemetry over extended periods reveals patterns you'd never catch with spot checks. It's not just about security it's about understanding:
- How we actually use the internet vs. how we think we use it
- Which devices are chattiest when we're not even using them
- What services our IoT devices are really connecting to
- Where in the world our data is actually traveling
What's Next
I've wrapped up the network monitoring component, but next I'm diving deeper into analysis of individual computers and containers. The goal is comprehensive visibility spanning from network traffic to system-level events.
This project started as a technical exercise but turned into a real privacy wake-up call. In an age where every appliance wants internet access, understanding what they're saying about us isn't just interesting it's absolutely essential.
Ever wondered what your smart devices are really up to when you're not looking? The tools to find out are more accessible than you'd think. Sometimes ignorance isn't bliss, it's just another vulnerability waiting to bite you